Private Credit Market Update: Q4-2024

All data as of December 31, 2024, unless noted otherwise.
Q4-2024 concluded a strong year for private credit as investors benefitted from attractive risk-adjusted returns and borrowers performed well through a transitioning macroeconomic environment. Senior secured loans to high-quality, mid-market companies are currently generating low double-digit gross yields with conservative structures and robust lender protections.
The market risk outlook is generally improving with recent indicators pointing to a healthy economy and robust labour market in the US, though geopolitical and inflationary implications of potential policy shifts including trade barriers, remain an open question. Within the mid-market, companies typically operate on a regional or national basis which creates more insulation from global supply chain and cross-border trade challenges. Private credit has performed well through prior periods of volatility and we expect prudently capitalized borrowers in resilient industries will continue to outperform.
We are seeing a few trends play out in today’s private credit market:
- US base rates are expected to remain ‘higher for longer’ with the market currently anticipating fewer rate cuts in 2025 than previously projected.
- Stronger investor confidence and incremental market liquidity is driving more M&A activity and increasing financing volumes.
- Market risk sentiment has improved with private credit spreads tightening ~80-100 bps in 2024 compared to 20231, though spreads are beginning to stabilize.
- Borrower performance has remained resilient, though bifurcation in industry performance is still evident.
Market anticipates fewer rate cuts than previously projected:
With continued strength in the US economy and uncertainty surrounding policy implications of the incoming administration, the markets’ expectations for short to medium term interest rates rose in Q4-24. The 3M forward SOFR curve increased by ~100 bps to 4.0% during the quarter. With the market anticipating base rates to remain elevated, senior secured loans are expected to provide investors with high single to low double-digit gross returns (on an unlevered basis) over the next three years.
Attractive Double Digit Returns
Gross Asset Yield on Senior Secured Loans
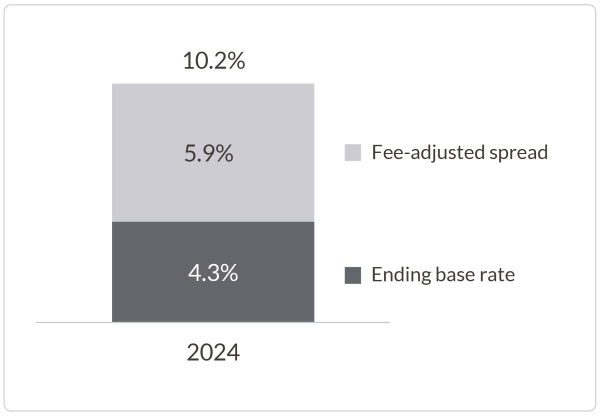
Fee-adjusted spread source: Cliffwater LLC. All Rights Reserved. Reproduced with permission. Sponsored Direct Lending New Issue 1L All-in Yields. Fee-adjusted spread represents spread and 3-year amortized OID figures averaged over 2024. Ending base rate source: Bloomberg; based on 3-month SOFR as at December 31, 2024. Past performance is not indicative of future returns.
Base Rates Projected to Remain Elevated
Current – 2027 Projected US Base Rates
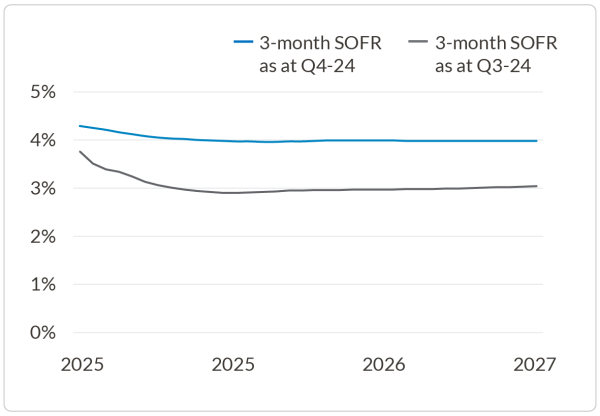
Source: Chatham Financial. 3-month SOFR forward curve from 2025 to 2027.
Stronger investor confidence is driving more M&A activity and increasing financing volumes:
Private credit deal flow increased quarter over quarter, largely consisting of refinancings and add-on capital to support borrower growth. LBO activity continues to show positive momentum, driven by several factors including but not limited to improving equity valuations, record levels of private equity dry powder and a continued push from private equity LPs for increased distributions.
Increasing Deal Volumes
Count of US Financing Transactions
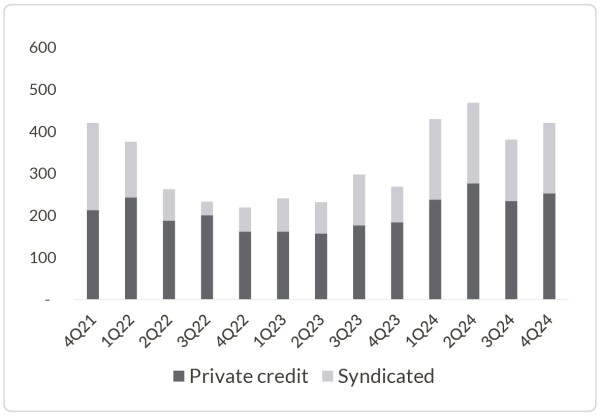
Source: Pitchbook/LCD. Data through December 31, 2024. Count is based on transactions covered by LCD News. There can be no assurance that any of the trends highlighted above will continue in the future. Excludes repricing and extension amendments; includes LBOs, refinancings and follow-ons.
Robust Demand for Refinancings/Add-On Capital; Expect Increase in LBO Activity
Type of US Financing Transactions - Last 12 Months
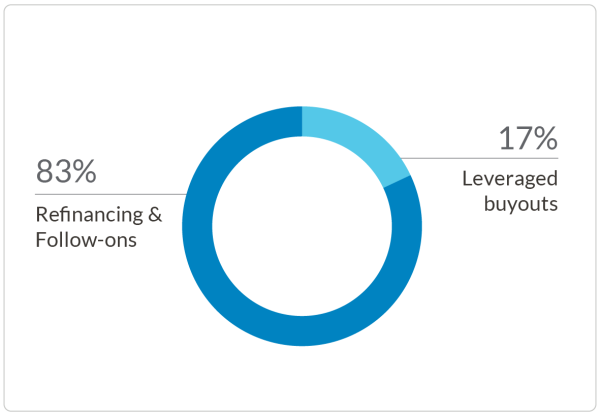
Source: Pitchbook/LCD. Data through December 31, 2024. There can be no assurance that any of the trends highlighted above will continue in the future.
Tighter 2024 private credit spreads expected to stabilize in 2025:
After several quarters of pricing compression, reflecting stronger investor confidence and more market liquidity, private credit spreads began to stabilize in Q4-24. Across private credit, spreads on senior secured loans were ~80-100 bps lower on average in 2024 as compared to 20231. The mid-market has typically remained better insulated with more negotiated loan terms, protective structures and ‘small clubs’ of lenders driving better pricing. Terms in the upper-mid market have begun blending with the broadly syndicated loan market, where excess dry powder has put competitive pressure on pricing and documentation. Importantly, private credit continues to offer investors a healthy return premium of ~200-220 bps compared to broadly syndicated loans and high yield bonds2.
Private Credit Provides an Attractive Return Premium
New Issue Spreads in US Broadly Syndicated Loans (BSL), US High Yield Bonds (HY), and US Direct Lending
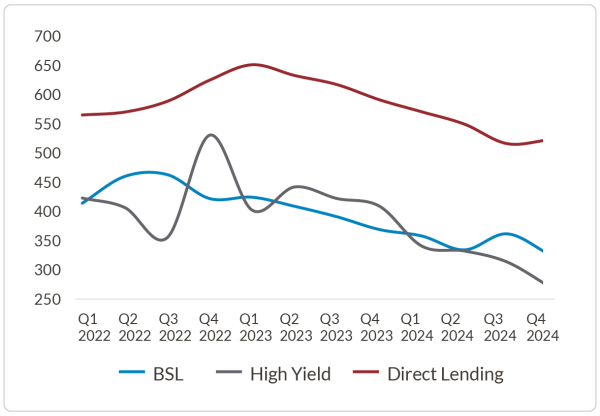
Direct Lending Source: Cliffwater LLC. All Rights Reserved. Reproduced with permission. BSL and High Yield Source: Pitchbook. Data through December 31, 2024. Quarterly figures calculated as a 3-month average.
Leveraged Loan Index (LLI) Trailing 12-Month Default Rate
By Issuer Count
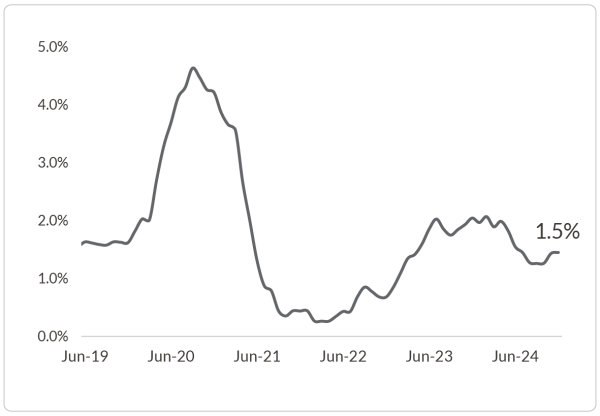
Source: Pitchbook/LCD; Morningstar LSTA US Leveraged Loan Index. Trailing 12-month default rate is based on number of defaults divided by total issuers. As of December 31, 2024.
Borrower performance remains resilient, though bifurcation in industry performance is evident:
Market defaults in Q4-24 trended modestly higher from the prior quarter, with the trailing 12-month default rate of the LLI ending the quarter at 1.5%, as compared to 1.3% in Q3-24. Borrowers have generally remained resilient and lower base rates have improved liquidity. In select instances where borrower liquidity is tighter, we have seen private equity sponsors support their portfolio companies with additional capital.
We are seeing stronger relative value in industries with recurring revenue models, pricing power, and traditionally stable cash flows, such as financial services, insurance brokerage, industrial maintenance services, and non-discretionary home services. We have seen a bifurcation of performance, with certain sectors currently showing some softness, including healthcare and consumer discretionary. Opportunities in asset-based specialty finance remain attractive for lenders, specifically in niche sectors requiring specialization and bespoke structuring expertise, which often have less coverage from traditional and generalist capital providers.
Throughout 2024, private credit has remained resilient and has provided investors with attractive risk-adjusted returns and contractual cash yield. In particular, mid-market private credit has historically delivered lower loss rates relative to public debt investments over the long term due to conservative structures and strong lender protections.
1. Source: Cliffwater LLC. All Rights Reserved. Reproduced with permission. Direct Lending New Issue 1L Spreads.
2. Direct Lending Source: Cliffwater LLC. All Rights Reserved. Reproduced with permission. BSL and High Yield Source: Pitchbook.
Endnotes:
Unless otherwise indicated, all figures and metrics are in USD and as at December 31, 2024.
“Cliffwater,” “Cliffwater Direct Lending Index,” and “CDLI” are trademarks of Cliffwater LLC. The Cliffwater Direct Lending Indexes (the “Indexes”) and all information on the performance or characteristics thereof (“Index Data”) are owned exclusively by Cliffwater LLC, and are referenced herein under license. Neither Cliffwater nor any of its affiliates sponsor or endorse, or are affiliated with or otherwise connected to, Northleaf Capital Partners, or any of its products or services. All Index Data is provided for informational purposes only, on an “as available” basis, without any warranty of any kind, whether express or implied. Cliffwater and its affiliates do not accept any liability whatsoever for any errors or omissions in the Indexes or Index Data, or arising from any use of the Indexes or Index Data, and no third party may rely on any Indexes or Index Data referenced in this report. No further distribution of Index Data is permitted without the express written consent of Cliffwater. Any reference to or use of the Index or Index Data is subject to the further notices and disclaimers set forth from time to time on Cliffwater’s website.
Important Notices:
This document is for informational purposes only and does not constitute a general solicitation, offer or invitation in any Northleaf-managed product in the United States or in any other jurisdiction and has not been prepared in connection with any such offer. The views and opinions expressed herein do not constitute investment or any other advice, are subject to change, and may not be validated by actual events. There can be no assurance that any of the trends highlighted above will continue in the future, Certain of the information set forth herein was gathered from various third-party sources which Northleaf believes to be accurate, but has not been able to independently verify.

