Private Equity Market Update: Q1-2025

The end of 2024 signaled a rebound in M&A activity and an improvement in distributions, whereas the first quarter of 2025 saw a more cautious tone amid rising global uncertainty.
Historically, private equity has generated attractive returns through different economic cycles, and secondaries, both LP-led and GP-led, are well-positioned in the current environment.
2025 has been characterized by increased market volatility and uncertainty driven by the U.S. administration's announcement of extensive new tariffs. The news triggered a historic public market sell-off across the Dow Jones, S&P 500, and Nasdaq. In response to rising uncertainty, companies pulled back on dealmaking, leading to a notable slowdown in M&A activity.
We have seen heightened volatility and uncertainty not previously seen since the COVID-19 pandemic, primarily driven by the U.S. administration's announcement of wide-ranging tariffs. The immediate aftermath of the reciprocal tariffs announced on April 2, 2025, saw the Dow Jones Industrial Average plummet by more than 1,340 points, and the S&P 500 lost 6.65% of its value on April 3 alone, nearly triggering a trading halt. In the two-day period following the announcement, the Dow Jones fell more than 9%; the S&P 500 dropped 10%; and the Nasdaq fell 11%, marking the worst two-day loss in U.S. stock market history. This sharp decline wiped out more than $6.6 trillion in market value, although these major indices have since recovered from those lows.
Market turmoil and uncertainty led to a further slowdown in an already softened M&A market. The number of deals announced in Q1 2025 fell 4%, year over year, and 12%, quarter over quarter.1 It is important to note that historically, private equity has generated attractive returns through different economic cycles.
Against this backdrop, we highlight the following key observations:
In the near term, we expect ongoing market dislocation to drive more motivated sellers in the secondary market, which should improve sourcing opportunities. At the same time, we are likely to see heightened due diligence as buyers navigate market uncertainty. In this environment, secondary sellers bringing higher-quality assets and newer fund vintages to market are more likely to retain their value.
2024 was a record year for secondaries deal flow, as volumes reached $160 billion. This momentum carried into the first quarter of 2025, with secondaries deal volumes of $45 billion, a 45% year-over-year increase. Similarly, GP-led secondary deal flow hit a record $71 billion in 2024, surpassing the previous peak in 2021, with momentum continuing into 2025, and approximately $25 billion in GP-led activity recorded in the first quarter alone.2
Investors are emphasizing disciplined, value-oriented underwriting and are closely monitoring their portfolio exposure to the impact of first and second-order tariffs. As traditional M&A activity moderates in response to macro uncertainty, GP-led secondaries will likely play an increasingly critical role in extending value creation for high-quality sponsor-backed companies. GPs are under increasing pressure to distribute liquidity back to investors. Continuation vehicles allow GPs to hold on to high-performing assets until exit environments strengthen, while distributing capital back to the original fund investors.
LP-led secondaries also remained active in the first quarter, with approximately $20 billion in transaction volume, consistent with the past five quarters.2 Ongoing macro volatility continues to support activity in this segment, reinforcing LP-led secondaries as a growing area of focus for private equity in 2025.
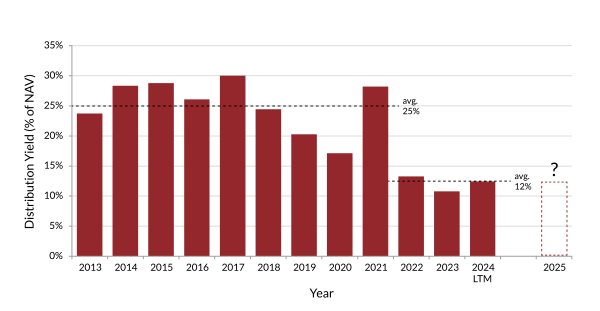
With private equity distribution yield falling, from an average of 25% of NAV (2013 – 2021) to just 12% of NAV over the past three years (2022 – 2024), LPs face pressure to unlock capital and seek the benefit of returns from new allocation opportunities. Furthermore, the denominator effect is prompting LPs to reassess their asset allocations and increasingly turn to the secondaries market to manage overallocation. This dynamic is expanding the opportunity set for secondary buyers with a broader range of sellers, including endowments, foundations, and public pensions, actively participating. At the same time, high-quality fund interests are becoming available at attractive valuations.
Distributions as a % of NAV3

In the long term, we expect the current environment to fuel the structural tailwinds driving secondaries market growth.
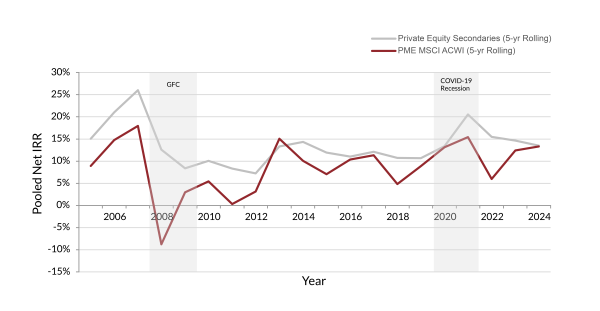
Secondaries have demonstrated consistent performance over time, often outperforming public markets, especially during periods of economic disruption, as illustrated in the figure below. Liquidity constraints in private equity and elevated market volatility are expected to be strong tailwinds for growth in the secondaries market. Strong returns amid market uncertainty have positioned secondaries as one of the fastest-growing and most innovative segments in private markets.
Secondaries Historically Outperform During Recessions4

Private equity, particularly a well-diversified mid-market portfolio, offers attractive opportunities, especially during periods of heightened market volatility, and should be well positioned in this current period of uncertainty.
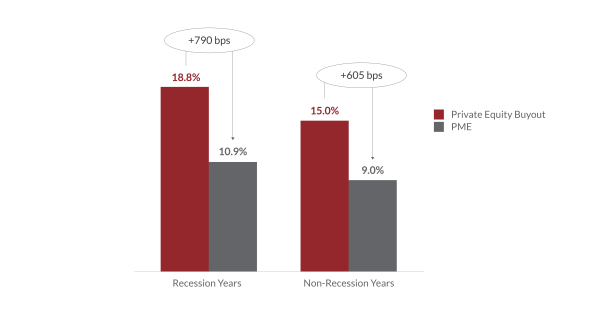
Private equity has historically demonstrated resilience across market cycles, outperforming the public markets by nearly 8% in recession years, as dislocations create compelling opportunities for disciplined deployment and long-term value creation (refer to Buyout Returns chart below). During downturns, active ownership of private equity-backed companies has helped protect value and selective entry points for new investments have benefitted as the cycle turns.
With over $1.8 trillion in private equity dry powder,5 the industry is well positioned to take advantage of current market conditions. In addition, private companies in the mid-market are particularly well placed in the current market environment, given they are generally local, regional, or national in scale, and thus less reliant on global supply chains at risk from trade policy.
Buyout Returns6
Average Net IRR by Vintage

Endnotes:
M&A Deals Announced Source: Market Watch: M&A activity falls as Wall Street clients tap the brakes on deals.
Secondary Market Source: PJT, Q1 2025 Secondary Market Insight, April 2025; Jefferies, Global Secondary Market Review, January 2025.
Distributions as a % of NAV: Data as at September 30, 2024. Cambridge Asset Class: Private Equity Buyout. Cash flow/NAV report. Past performance is not an indication of future performance. There can be no assurance that any of the trends highlighted will continue in the future.
Secondaries Outperformance: Data as at September 30, 2024. There can be no assurance that the trends highlighted will continue in the future. Past performance is not an indication of future results. Private Equity Secondaries is represented by The Cambridge Secondary Funds Index (the “Secondary Funds Index”), which represents secondaries, uses a horizon calculation based on data compiled from 334 secondary funds, including fully liquidated partnerships, formed between 1991 and 2023. Performance is annualized over rolling five-year periods. The MSCI ACWI is represented by MSCI All Country World Index - Total Return (the “MSCI Index”). This PME is used to evaluate the performance of The Secondary Funds Index against a public market benchmark or index, in this case the MSCI Index. Every capital contribution and distribution of the Secondary Funds Index is matched by an equal and timely investment and sale of the reference MSCI Index, respectively. The resulting PME IRR provides a basis for comparison against the Secondary Funds Index IRR; however, the investment strategy of the MSCI Index differs from the strategy pursued by funds representing the Secondary Funds Index and accordingly a direct comparison may not be meaningful.
Dry Powder Source: Data as at December 31, 2024. Private Equity Preqin data, excluding venture and growth.
Buyout Returns: Source: Cambridge Associates; as of September 2024. Represented by the pooled returns per vintage year. Includes global buyout investment returns from 1990 to 2021. 2022-2024 vintage returns are not included due to the early stages of the investment period. Recession years include 1990, 1991, 2001, 2002, 2008, 2009, 2020; all other years in this time period are categorized as non-recession years. The Benchmark PME is represented by the MSCI World Total Return Index.
Important Notices:
This document is for informational purposes only and does not constitute a general solicitation, offer or invitation in any Northleaf-managed product in the United States or in any other jurisdiction and has not been prepared in connection with any such offer. The views and opinions expressed herein do not constitute investment or any other advice, are subject to change, and may not be validated by actual events. There can be no assurance that any of the trends highlighted above will continue in the future, Certain of the information set forth herein was gathered from various third-party sources which Northleaf believes to be accurate but has not been able to independently verify.

