Private Credit Market Update: Q1-2025

Market commentary covers Q1-25 and the period through April 17th.
Investor optimism at the start of 2025 has pivoted to a cautious stance, with trade policy tension and ensuing macroeconomic uncertainty driving market volatility. Short-term concern surrounding tariff policy is tempering market activity, while inflationary and economic growth implications will continue to weigh on investor sentiment. First order tariff impacts may be swift, but second and third order impacts on consumer spending, inflation, business planning and other factors may take time to unfold. Against this backdrop, it’s important to note that private credit has historically performed well through periods of market volatility given its defensive characteristics.
While tariff policy remains fluid, the market generally believes that the risk of higher inflation and slower economic growth has increased. The path of monetary policy is also more uncertain and will largely depend on how tariffs work their way through the economy. The current market expectations are for US base rates to remain elevated at 3.5%, on average, over the next three years.1 As a floating rate asset class, private credit should continue to deliver attractive absolute and relative returns.
Against a backdrop of uncertainty, we are seeing a few trends play out in today’s private credit market:
- The brief rebound in new M&A activity and related financings in early Q1-25 was cut short. We expect to see a pullback in M&A financings until market volatility subsides, although volatility typically creates opportunities for private credit lenders to gain market share.
- Private credit spreads largely stabilized in Q1-25 following several quarters of compression, and market participants are now navigating a period of price discovery in an evolving risk environment. We expect to see credit spreads adjust higher, at least in the short term, to reflect elevated risk with overall yields remaining attractive.
- Mid-market private credit borrowers are typically well insulated from direct tariff impacts as the focus on defensive industries with stable cash flows has historically driven resilient borrower performance.
M&A and related financings were off to a strong start in early 2025 but have since pulled back as investors pause to digest uncertainty.
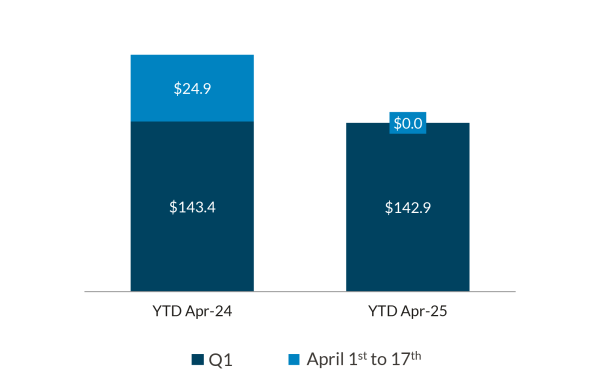
We observed a busy start to the year for new issue activity, with a pickup in LBO issuance as LBO-related broadly syndicated loan volumes were up ~44% year-over-year in Q1-25.2 This was followed by a slowdown in market activity towards the end of the quarter and a complete pause on new issuances in early April.4 Investor sentiment transitioned from a “risk-on” to a “wait-and-see” approach as trepidation began to build on tariff expectations and subsequent policy announcements. We are seeing early evidence of “flight to quality” toward less disrupted industries and higher-quality borrowers.
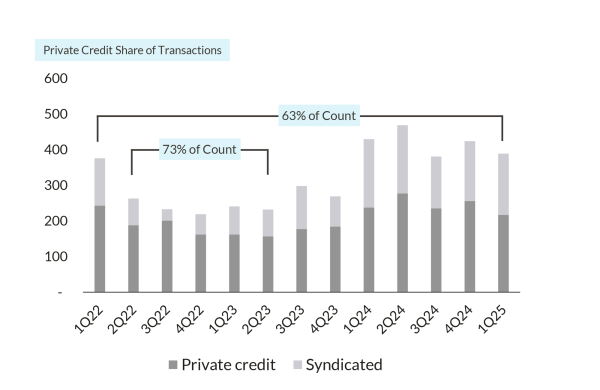
Uncertainty also creates opportunities. During periods of market turbulence, banks and liquid credit markets tend to retrench, paving the way for private credit solutions to price loans at attractive levels with strong collateral protections. In prior periods of volatility, private credit has gained market share given its flexibility and greater execution certainty. (Refer to the graph below, which shows >70% of transactions financed by private credit in mid-2022 to 2023 when market volatility was elevated due to inflation, rising interest rates and successive bank failures). Over the medium term, markets still anticipate a tailwind for M&A volumes, driven by record levels of private equity dry powder and a continued push from private equity investors for liquidity.
Private Credit Continues to be the Preferred Source of Financing3
Count of US Financing Transactions Across Private Credit and Broadly Syndicated Loan Market

Pause on New Issuance in the Leveraged Loan Market in April-254
Broadly Syndicated Loan Market Institutional Volume (in billions)

Market participants are navigating a period of price discovery in an evolving risk environment; yields remain attractive driven by upward pressure on spreads and elevated base rates.
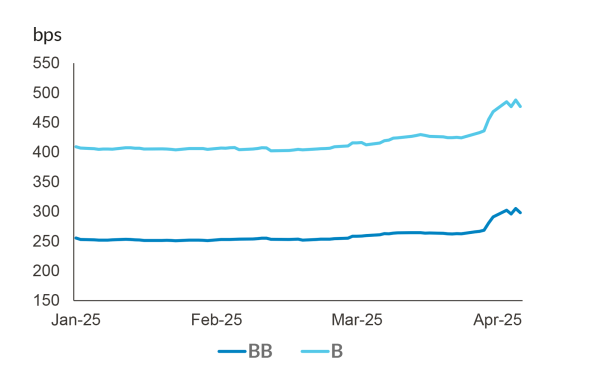
The stabilizing trajectory of private credit spreads in early 2025 will likely evolve to an upward repricing of risk, at least in the short term. Liquid debt markets exhibited prompt responses following the tariff announcements with spreads in the secondary market widening 25 to 75 bps across high yield and leveraged loans.6 Private credit spreads have typically been slower to adjust, although we have observed spreads on certain new mid-market loans widen by ~50 bps in early April. Following the theme of “flight to quality,” we also anticipate bifurcation in pricing between tariff-impacted and non-impacted borrowers and sectors.
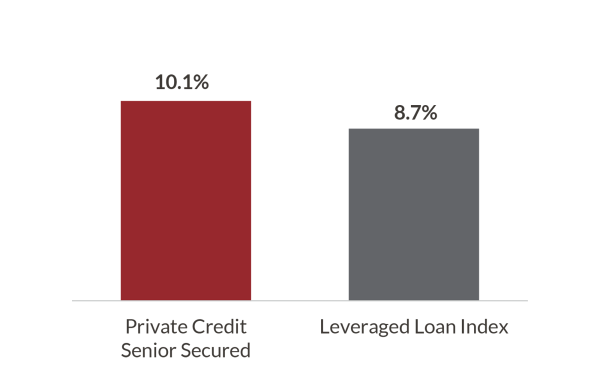
Despite the potential for slower growth, market participants generally believe that the direction of US policy on tariffs, immigration and other areas point to higher expected inflation, which should support elevated interest rates over the medium and long term. With elevated base rates and credit spreads stabilizing or even widening, private credit yields should provide strong absolute and relative yields for investors.
Attractive Absolute and Relative Yields for Private Credit5
Gross Asset Yield (As of March 31, 2025)

Increase in Spreads in the Secondary Market6
Leveraged Loan Index Spread to Maturity (As of April 10, 2025)

Mid-market borrowers are typically well insulated from tariff impacts and have remained resilient in prior periods of market volatility.
We expect mid-market private credit portfolios to be relatively well insulated from tariff impacts given that these borrowers are typically regional or national centric with more limited exposure to cross-border trade in goods. Mid-market private equity-backed companies typically also have minimal exposure to the most heavily impacted sectors (e.g., autos, heavy manufacturing and retail) and a high proportion of service-based businesses with minimal exposure to first-order tariff risks (e.g., healthcare services, B2B service providers, software and financial services). From a second-order impact perspective, essential businesses with entrenched market share, pricing power and conservative capital structures should remain resilient even in the face of an economic slowdown.
Across the market, defaults trended largely in line with the prior quarter, though they remain below historical averages. The trailing 12-month default rate of the US Leveraged Loan Index ended March 31, 2025 at 1.2%, as compared to 1.5% in Q4-24.7
Private credit remains resilient and has provided investors with attractive risk-adjusted returns and contractual cash yield. In particular, mid-market private credit has historically delivered lower loss rates relative to leveraged loans and high yield debt due to conservative structures and strong lender protections.
Endnotes:
Unless otherwise indicated, all figures and metrics are in USD and as at March 31, 2025.
“Cliffwater,” “Cliffwater Direct Lending Index,” and “CDLI” are trademarks of Cliffwater LLC. The Cliffwater Direct Lending Indexes (the “Indexes”) and all information on the performance or characteristics thereof (“Index Data”) are owned exclusively by Cliffwater LLC, and are referenced herein under license. Neither Cliffwater nor any of its affiliates sponsor or endorse, or are affiliated with or otherwise connected to, Northleaf Capital Partners, or any of its products or services. All Index Data is provided for informational purposes only, on an “as available” basis, without any warranty of any kind, whether express or implied. Cliffwater and its affiliates do not accept any liability whatsoever for any errors or omissions in the Indexes or Index Data, or arising from any use of the Indexes or Index Data, and no third party may rely on any Indexes or Index Data referenced in this report. No further distribution of Index Data is permitted without the express written consent of Cliffwater. Any reference to or use of the Index or Index Data is subject to the further notices and disclaimers set forth from time to time on Cliffwater’s website.
1. Based on the average forward 3M SOFR curve from March 31, 2025 to March 31, 2028.
2. Source: PitchBook / LCD. Data for the US Leveraged Loan Index through March 31, 2025.
3. Source: Pitchbook/LCD. Data through March 31, 2025. Count is based on transactions covered by LCD News. There can be no assurance that any of the trends highlighted above will continue in the future. Excludes repricing and extension amendments; includes LBOs, refinancings and follow-ons.
4. Source: Pitchbook/LCD. Data through April 17, 2025. Issuance is based on transactions covered by LCD News. There can be no assurance that any of the trends highlighted above will continue in the future. Excludes repricing and extension amendments; includes LBOs, refinancings and follow-ons.
5. Private Credit Source: Cliffwater LLC. All Rights Reserved. Reproduced with permission. Sponsored Direct Lending New Issue 1L All-in Yields. Considers the Fee-adjusted spread (spread and 3-year amortized OID figures averaged over LTM Q1-25); and Q1-25 ending base rate (as per Bloomberg; based on 3-month term SOFR as of March 31, 2025). Past performance is not indicative of future returns. Leveraged Loan Index Source: Pitchbook / LCD. Data as of March 31, 2025.
6. Source: PitchBook / LCD; Morningstar LSTA US Leveraged Loan Index. Daily Spread to Maturity on BB and B rated loans. Data through April 10, 2025. There can be no assurance that any of the trends highlighted above will continue in the future.
7. Source: Pitchbook/LCD. Data through March 31, 2025. Calculated as the LTM count of defaults / total issuers.
Important Notices:
This document is for informational purposes only and does not constitute a general solicitation, offer or invitation in any Northleaf-managed product in the United States or in any other jurisdiction and has not been prepared in connection with any such offer. The views and opinions expressed herein do not constitute investment or any other advice, are subject to change, and may not be validated by actual events. There can be no assurance that any of the trends highlighted above will continue in the future, Certain of the information set forth herein was gathered from various third-party sources which Northleaf believes to be accurate, but has not been able to independently verify.
This document has been prepared solely for information purposes by Northleaf, and by accessing it, you hereby agree that it is being made available on the express understanding that it will not be reproduced by you to third parties without Northleaf’s prior written consent.
Northleaf Capital Partners® and Northleaf ® are registered trademarks of Northleaf Capital Partners Ltd. All rights reserved.

